We Got the Time Zone Wrong: Correcting Our Audit of the Viral 'Institutional Protocol' ORB Validation
We re-executed Fabio Valentini's IVB opening-range-breakout model on real NQ tick data and reported that $151k became $42k. That was our error: the report's parameters are Chicago time, not New York, so we tested a pre-open range the strategy never used. Corrected, the published logic gives 784 trades at 58.9% winners and +$121k over five years, against the report's 823 trades at 57.7%. The clock — not the entry rule and not the delta filter — carries the whole result.
Correction — 31 July 2026
The original version of this article was wrong, and the error was ours. We read the report’s parameters as New York time; they are Chicago time. That put our opening range an hour before the one the strategy actually uses. The article below has been rewritten with the corrected results. Our apologies to Fabio Valentini and to Matteo Conti.
On 20 July we published an audit of the “Institutional Protocol” — Matteo Conti’s statistical
validation of Fabio Valentini’s opening-range-breakout model, the one that went round X with
P(EV ≤ 0) = 0.001 and a VALIDATED / DEPLOYABLE stamp on the last page. We re-executed the
published EasyLanguage on our own NQ tick store and reported that the claimed $151,013 came out at
+$42k, with the win rate collapsing from 57.7% to 52.6%.
That result was an artefact of our own mistake. Here is what happened, what the numbers actually are, and the one habit that would have caught it on day one.
The mistake
The report’s input panel reads:
ORB_Start_H_NY   8      ORB_Start_M_NY   30
ORB_Dur_Min      30     Trade_End_H_NY   14
The variable names say _NY. We took them at their word and built the opening range from 08:30 to
09:00 New York time — an hour before the equity cash open, in the thin pre-market tape.
Those values are Chicago time. 8:30 is 08:30 CT, which is 09:30 ET: the cash open, the
single most active thirty minutes of the NQ session. Trade_End 14 is 15:00 ET.
The report told us so, and we wrote it off. Its prose says positions are “flattened on the bar that crosses 15:00 ET” while its input panel says 14. We flagged that as an internal contradiction, tested both, and moved on. It was never a contradiction. It was the one-hour offset, sitting in plain sight.
What the corrected numbers look like
Same rules, same costs, same tick store — only the clock label read correctly.
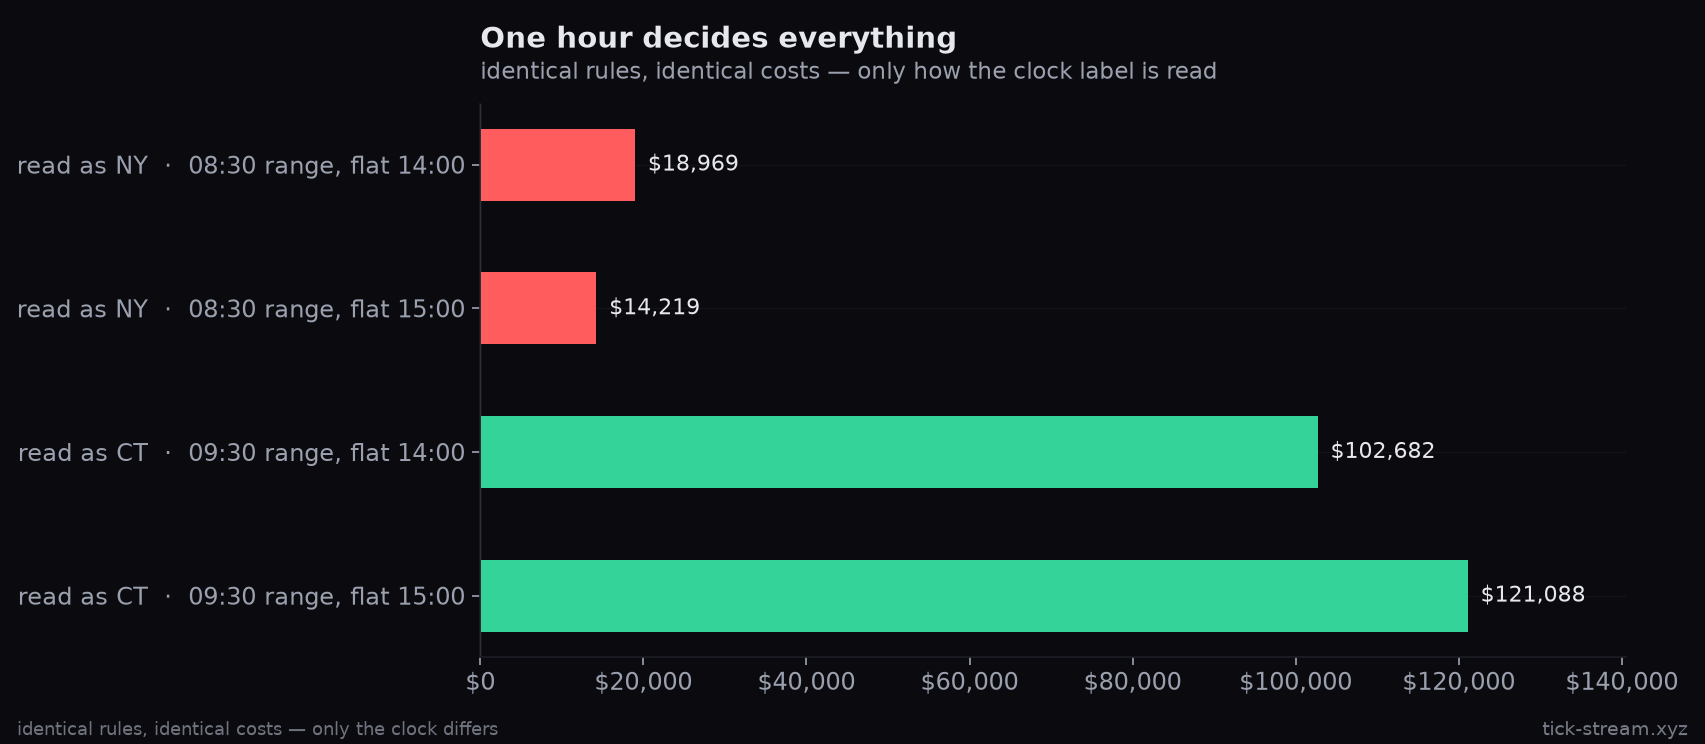
Under the literal New York reading, the strategy is a coin flip: +$18,969 over 957 trades, t = 0.49. Under the Chicago reading it is +$121,088 over 784 trades, t = 2.39. Identical entry logic, identical stop, identical target, identical cost model. One hour.
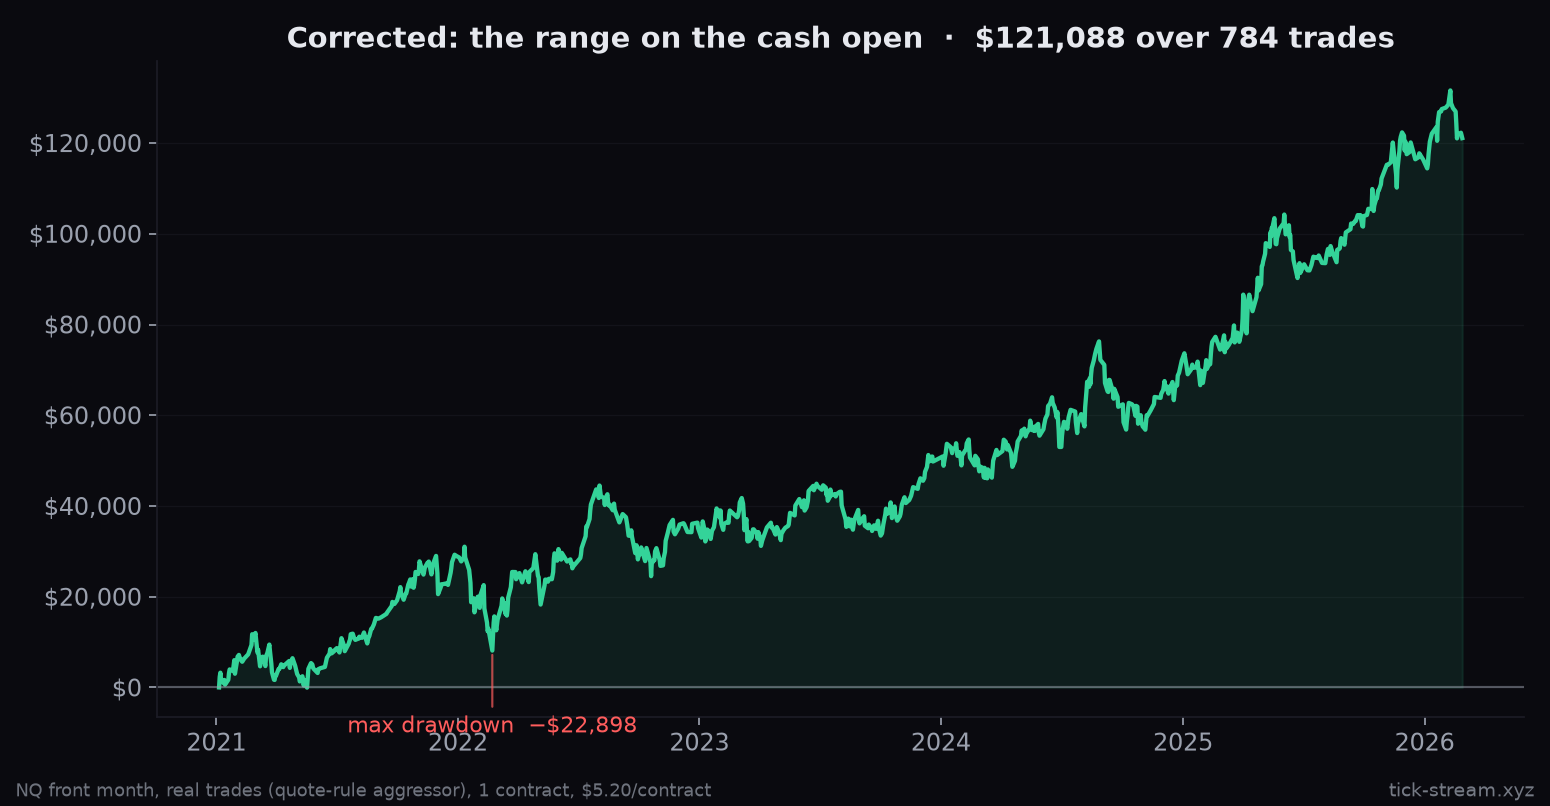
| Report’s claim | Our corrected run | Our original (wrong) run | |
|---|---|---|---|
| Trades | 823 | 784 | 945 |
| Win rate | 57.72% | 58.9% | 52.6% |
| Net, 1 contract | $151,013 | $121,088 | $42,458 |
| Avg per trade | $183.49 | $154.45 | ~$45 |
| Max drawdown | $25,897 | $22,898 | — |
| t-stat | — | 2.39 | 0.96 |
The remaining gap is cost model and fill detail, not structure. Their $4.50 commission plus a one-tick slippage charge is a different assumption from our flat $5.20 per contract, and 823 trades against our 784 means their engine took a handful of entries ours declined. What matters is that the shape matches: same win rate, same drawdown envelope, same order of magnitude.
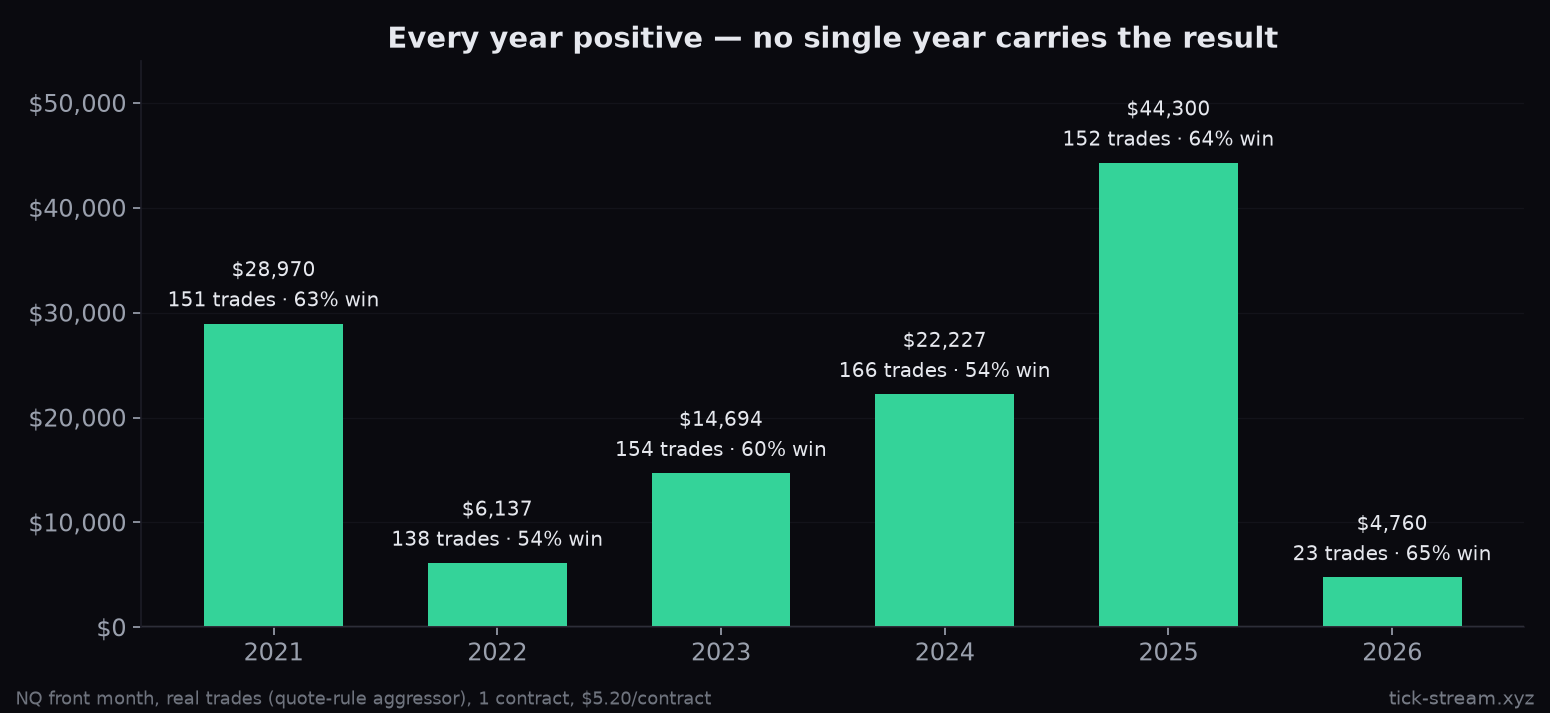
And the distribution is healthier than the original audit suggested. Our wrong run had 2024 contributing $36k of a $42k total — textbook regime concentration. The corrected run spreads it: every one of the five full years is positive, the weakest (2022) still adds +$6,137, and no single year carries the edge.
The delta filter does nothing
This is the part worth sitting with.
The model’s distinguishing feature is a volume-delta gate: only take the breakout if the signal bar prints at least 200 contracts of net buying. Our original audit measured that filter and reported it as the model’s genuinely good idea — it lifted the average trade from +$3 to +$45.
On the correct session window, it is worth nothing:
| Delta threshold | Trades | Net | t |
|---|---|---|---|
| 0 (no filter) | 819 | +$124,131 | 2.38 |
| 200 (the report’s) | 784 | +$121,088 | 2.39 |
| 500 | 667 | +$65,362 | 1.42 |
| 1000 | 228 | −$20,546 | −0.77 |
The filter costs a little at the report’s own threshold and destroys the edge above it. Its apparent usefulness in our first audit was a symptom of the broken window: on a pre-open range with no real edge, a filter that removes trades removes losses. On a session that actually works, there is nothing to rescue.
That reverses one of the compliments we paid the model. The delta gate isn’t the clever part. The clever part — and it is genuinely clever — is trading the cash-open range at all.
What carries it
We ran the full grid on real ticks: range window × entry mechanic × cutoff, eight combinations, one pass over the tape.
| Change | Marginal effect on net P&L |
|---|---|
| Range 08:30 → 09:30 | +$133,606 |
| Entry: 5-min close → resting buy-stop | +$33,253 |
| Cutoff 14:00 → 15:00 | +$16,675 |
With the 08:30 range, all four variants are statistically flat (|t| ≤ 0.36). With the 09:30 range, all four are significant (t = 2.14 to 3.19). The session window isn’t a parameter of this strategy. It is the strategy.
The habit that would have caught this
We had the answer in front of us the whole time: the trade count.
The report says 823 trades. Our first run produced 945 — 15% more, on a spec we believed we had implemented exactly. We noticed, shrugged, and went hunting for the difference in the win rate instead, because the win rate was where the dollars were.
A 15% mismatch in trade count on an identical specification is not a rounding difference. It means you are not running the same strategy. Our corrected run lands on 819 trades against their 823 — that is what agreement looks like.
So, a rule we are adopting for every third-party audit from here: reconcile the trade count before you discuss a single dollar of P&L. If the counts don’t line up, the disagreement isn’t about fills or costs or slippage. It’s about specification, and no amount of statistics downstream will tell you that.
What still stands from the original audit
Two things, both about method rather than this particular model.
The report’s statistical machinery — 1,000 permutations, a 20,000-path Monte Carlo, bootstrap confidence intervals — is competently built and pointed at the wrong object. Every one of those procedures resamples the MultiCharts trade log. Resampling a log measures the sampling error of that log; it cannot detect whether the fills in it are achievable. The report says so itself, to its author’s credit: “no independent re-execution of the strategy on raw market data was performed.”
We performed that step, twice — once badly, once properly. The second time it confirmed the report’s headline rather than refuting it. That is a better outcome for everyone than our first attempt, and it only exists because the specification was published in full. Strategies that ship their source can be checked. Most can’t.
Methodology: NQ front-month tick store, 1,556 sessions 2021-01-04 to 2026-04-16. Real trades only (side 2; sides 0/1 are bid/ask quotes). Aggressor via quote rule against the reconstructed BBO — median spread at trade time 1 tick, 0% inverted, 0.01% of 481M prints inside the spread. Opening range and 5-minute signal bars built from the tape; stop-versus-target resolved by tick order, so no same-bar fill assumption. One contract, $5.20 per contract, zero slippage. Delta thresholds 0/200/ 500/1000 and both cutoffs tested; the 2×2×2 grid additionally tests a resting buy-stop entry. All figures per single contract. This is research, not trading advice; our live, disclosed track records are on /algos.
Frequently asked questions
What did you get wrong?
We read the report's parameters as New York time. They are Chicago time. The input ORB_Start_H_NY is set to 8:30, which is 08:30 CT — 09:30 ET, the equity cash open — and Trade_End_H_NY 14 is 15:00 ET. We built the opening range from 08:30 to 09:00 New York, an hour before the cash open, which is a session the strategy never traded. Every number in our original audit came from that wrong window.
How do you know the Chicago reading is the right one?
The trade count. Running the report's own logic on the 09:30–10:00 ET range produces 819 trades without the delta filter and 784 with it, against the report's 823. Win rate lands at 58.7% versus their 58.32%. Our original run produced 945 trades at 52.6% — a 15% mismatch in trade count that should have stopped us at the time. There is also a signpost in the report itself: its prose says positions flatten at 15:00 ET while its input panel says 14. We wrote that up as sloppiness. It is exactly the one-hour offset.
So does the strategy work?
On real tick data over 2021 to April 2026, the published logic nets +$121,088 across 784 trades at 58.9% winners, t=2.39, with a maximum drawdown of $22,898 — one contract, $5.20 per contract in costs. Every year is positive. That is a real, modest, statistically significant edge, and it is broadly consistent with what the report claimed. Their net is higher ($151,013) on a different cost model and 823 trades, but the shape and the win rate match.
Does the volume-delta filter help?
No. On the correct session window it does nothing: no filter gives +$124,131 over 819 trades, the report's threshold of 200 gives +$121,088 over 784. Raising it destroys the edge — 500 drops to +$65,362 and 1000 turns negative at −$20,546. Our original audit reported the filter as genuinely helpful, improving the average trade from +$3 to +$45. That improvement was an artefact of the wrong session: on the pre-open range the filter rescues a strategy that has nothing to work with. On the real one there is nothing to rescue.
What actually carries the edge?
The session window, by a wide margin. We ran a 2×2×2 over range window, entry mechanic and cutoff on real ticks. Moving the range from 08:30 to 09:30 is worth $133,606 on average across the other two dimensions. Switching from a five-minute close to a resting buy-stop is worth $33,253. The cutoff is worth $16,675. With the 08:30 range every variant is statistically flat (|t| ≤ 0.36); with the 09:30 range every variant is significant (t = 2.14 to 3.19).
How was this audit run?
NQ front-month tick store, 1,556 sessions from January 2021 to April 2026. Real trades only — the store's sides 0 and 1 are bid/ask quotes, side 2 is the tape, and confusing them is how order-flow studies accidentally measure quote flow. Aggressor side comes from the quote rule against the prevailing best bid and offer, reconstructed from the BBO stream: median spread at trade time is exactly one tick, zero inverted quotes, and 0.01% of 481 million prints fell inside the spread. Ticks are time-ordered, so stop-versus-target is settled by whichever prints first, with no same-bar fill assumption to argue about.