All Three ICT Entry Setups Lose on 12.5 Years of ES, and the One That Paid Was Our Own Bug
We ran order blocks, fair value gaps, liquidity sweeps and Optimal Trade Entry on 290,664 ES 15-minute bars, each against a purpose-built placebo. All three entry setups lose: order blocks $19.45 a trade, fair value gaps $19.51, liquidity sweeps $30.33. The fair value gap originally read +$34.07 and was the only survivor in this battery; that number came from a fill-selection bug in our own engine, and corrected it loses in twelve of thirteen years. Optimal Trade Entry does pay in all five retracement bands, and the famous 0.62–0.79 zone is the second worst of them at $8.46 against $32.49 for the 0.50–0.62 band.
Four ICT concepts, twelve and a half years of S&P 500 futures, each against a placebo built to isolate the idea rather than flatter it. Three of the four are entry setups and all three lose money: order blocks $19.45 a trade, fair value gaps $19.51, liquidity sweeps $30.33.
The fourth, Optimal Trade Entry, does pay — but not in the place its name points to.
This article originally said something different. It reported fair value gaps making +$34.07 a trade and called them the only setup in the battery to beat its control. That number was produced by a bug in our own fill engine. We explain it below, because the correction is more useful than the result it replaced.
The rules
All four on ES 15-minute bars, 290,664 of them, 2 January 2014 to 10 September 2026, all sessions.
- Order block. The last opposite-coloured candle before a move that takes out its extreme. A limit rests at the block’s open for up to 48 bars, live from the bar after the move confirms.
- Fair value gap. A three-bar imbalance — bar
i’s low above bari−2’s high is bullish. The limit rests at the middle of the gap, for up to 48 bars. - Liquidity sweep. Price trades through the prior day’s high or low and closes back inside. Entry at that bar’s close, against the sweep.
- Optimal Trade Entry. A 20-bar swing leg, then a retracement into a named band of it. Trend from EMA-50 read on the previous bar’s close; entry at the near edge of the band.
Bracket on all four: stop 1× ATR(14), target 2× ATR(14), 48-bar timeout, a bar holding both scored as the stop, one position at a time. One contract, $29.50 a round trip.
What the three entry setups did
| Order block | Its placebo | Fair value gap | Its placebo | Liquidity sweep | Its placebo | |
|---|---|---|---|---|---|---|
| Trades | 11,772 | 9,914 | 17,342 | 7,151 | 7,241 | 11,270 |
| Win rate | 35.9% | 35.3% | 35.0% | 35.5% | 34.0% | 32.6% |
| Per trade | −$19.45 | −$25.27 | −$19.51 | −$20.08 | −$30.33 | −$37.93 |
| Total | −$229,006 | −$250,498 | −$338,428 | −$143,592 | −$219,633 | −$427,431 |
| Profit factor | 0.892 | 0.854 | 0.894 | 0.790 | 0.847 | 0.790 |
| t | −4.49 | −5.66 | −5.41 | −3.53 | −5.15 | −8.95 |
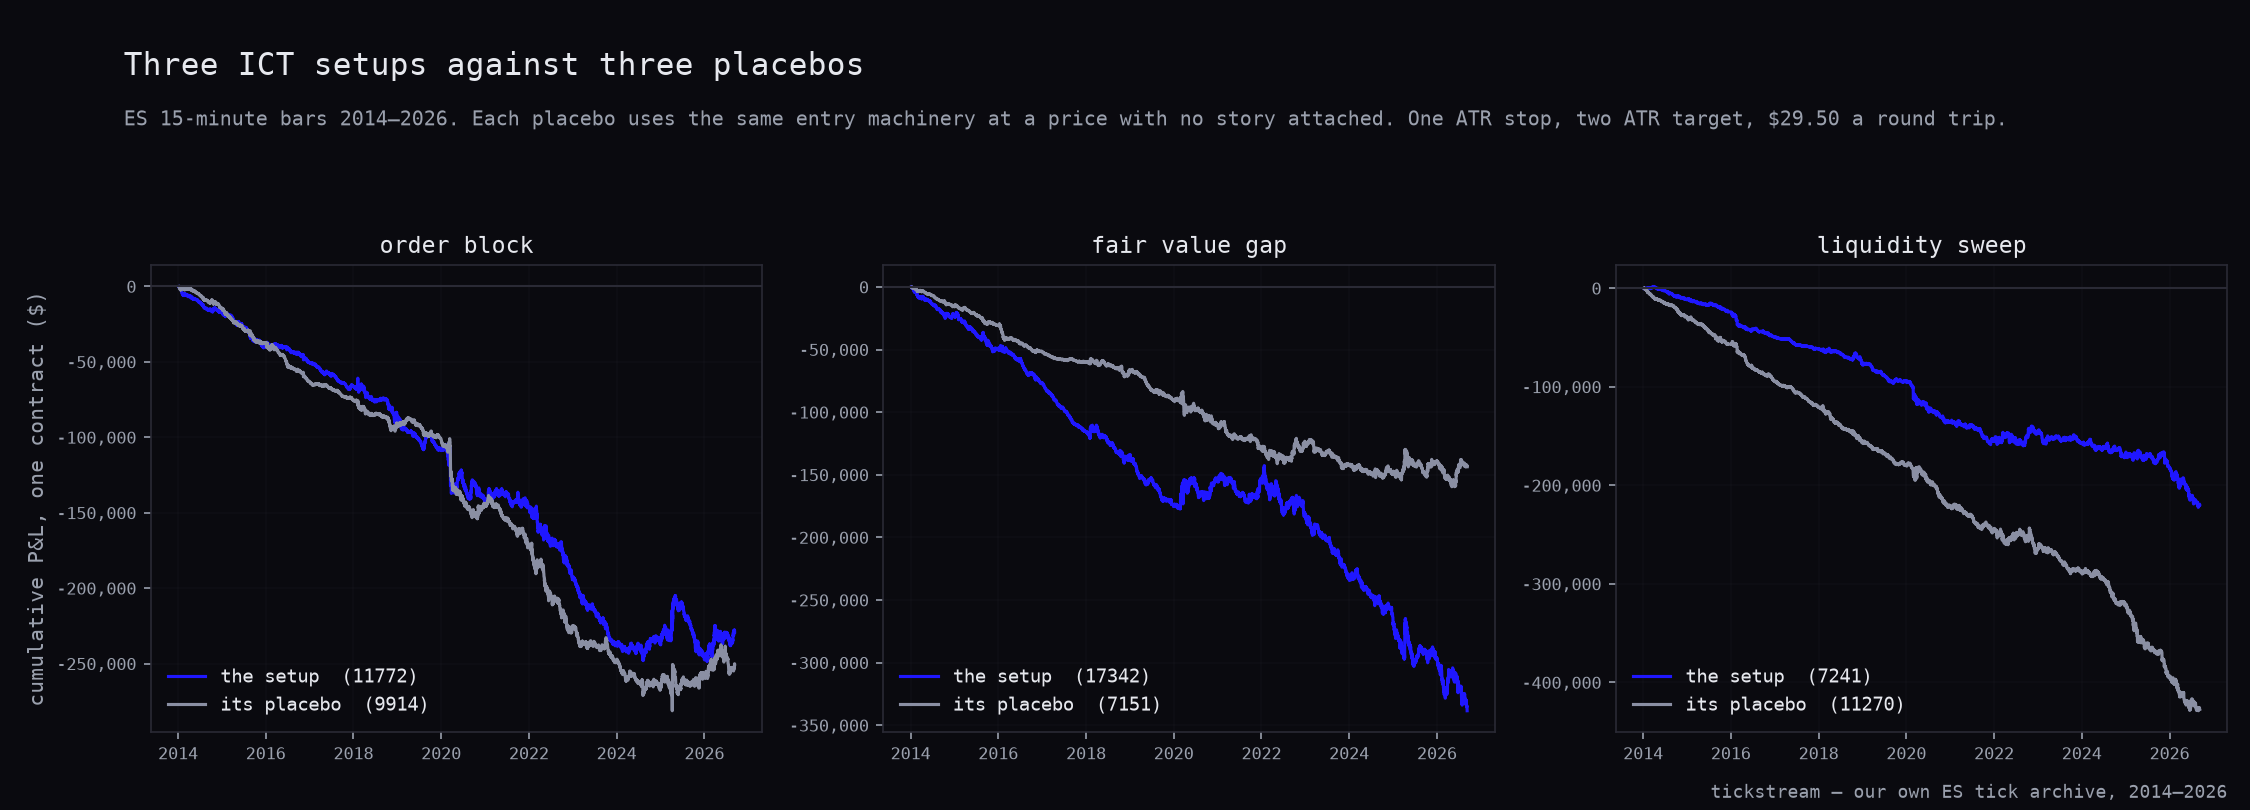
Six lines, all of them down and to the right. Two of the three setups do beat their placebos — order blocks by $5.82 a trade and sweeps by $7.60 — and it is worth being precise about what that means. It means the named price loses less than an unnamed one. A level that is $5.82 less bad than a random level is not a level worth trading; it is a slightly cheaper way to lose.
The fair value gap panel is the one to look at. The blue line finishes below its grey placebo. The gap loses more in total than the price with no story attached, and per trade the two are 57 cents apart.
The bug that made this a different article
The first version of this test wrote the fill like this, and so did every other resting-limit test in the series:
for i in signals:
    if i <= busy: continue
    lvl = level_price(i)
    for j in range(i + 1, i + 49):   # walk THIS gap's future to its fill
        if touched(j, lvl):
            pnl, xi = bracket(j, lvl)
            out.append(pnl); busy = xi
            break
The outer loop takes gaps in the order they form. Each one searches its own future for a fill. busy only moves when a trade is taken.
So a gap formed at bar 10 and filled at bar 40 sets busy past a gap formed at bar 12 that would have filled at bar 15. The run keeps the later fill and deletes the earlier one. No future price enters the entry decision, but which of several resting orders you are filled on does — and that is a choice only the future can make.
We measured it directly: 33.9% of the trades the old code kept were entered after an already-formed sibling gap had been touched. Live, that sibling takes the book and the kept trade never exists.
The bias runs one way. A gap that takes a long time to fill is a gap price travelled far to reach, which is a deeper entry with more room before the stop. The shallow fills that trigger two bars later and get stopped are precisely the ones a slow-filling sibling deletes. The old engine was not sampling the setup’s trades; it was sampling its best ones.
| Old engine | Corrected | |
|---|---|---|
| Trades | 14,005 | 17,342 |
| Per trade | +$34.07 | −$19.51 |
| Total | +$477,218 | −$338,428 |
| t | +8.06 | −5.41 |
The trade count is the tell. The correction does not remove trades, it adds 3,337 — the ones the old code suppressed, and the ones that lose.
Every result in this series that rests a limit now runs through one shared engine that walks bars forward once, lets levels compete, and fills whichever is touched first. Where one bar touches several, it fills the one nearest that bar’s open, because the path inside a bar is not knowable and should not be assumed helpful.
The gap, now that the fills are honest
Both halves of the archive are negative. Train 2014–2020 loses $16.72 a trade at t = −4.59 across 9,222 trades; holdout 2021–2026 loses $22.69 at t = −3.49 across 8,120.
Twelve of thirteen calendar years are red. The exception is 2020 at +$20,984 across 1,537 trades, which is the year everything that buys a dip worked. The worst is 2023 at −$50,616.
The slippage ladder no longer has a rung worth arguing about: −$19.51 at zero ticks, −$32.01 at one, −$44.51 at two, −$57.01 at three.
The placebo we had to build twice, which still matters
We kept this section because the reasoning survives the result.
Our first fair-value-gap placebo put a limit at a random 0.5–2.5 ATR from price. We threw it out, and the reason is worth more than the number it produced. A limit resting far from price is a different trade from one resting close to it. It fills less often, it fills on faster moves, and it fills at a worse point in the swing. A placebo drawn at a random distance is therefore not a control for the fair value gap. It is a second strategy with its own distance profile, and comparing the two tells you which distance profile you prefer.
The placebo in the table draws its entry distance from the real gaps’ own distribution — mean 4.55 points, median 2.75 — and places it on bars with no imbalance at all, same EMA-50 side. Same distance, same trend, no gap. That is the only version that isolates the imbalance, and against it the imbalance is worth 57 cents a trade.
Optimal Trade Entry, where the Fibonacci number is the wrong part
OTE never rests a limit — it enters at the bar that reaches the zone — so the bug above cannot reach it, and these figures are unchanged.
| Retracement band | Trades | Win rate | Per trade | Total | t |
|---|---|---|---|---|---|
| 0.20–0.38 (shallow) | 23,419 | 38.1% | +$5.31 | +$124,350 | 1.68 |
| 0.38–0.50 | 17,450 | 42.1% | +$31.18 | +$544,092 | 8.71 |
| 0.50–0.62 | 13,841 | 42.4% | +$32.49 | +$449,685 | 8.26 |
| 0.62–0.79 (the OTE zone) | 12,846 | 39.6% | +$8.46 | +$108,738 | 2.18 |
| 0.79–0.95 (deep) | 8,608 | 40.1% | +$9.54 | +$82,162 | 2.12 |
All five bands pay. The band the method is named after pays $8.46, which is second worst of the five, while the two bands just above the midpoint pay roughly four times that at t over 8.
The honest reading is not “OTE works”. It is that buying a pullback into a trend works on ES, and the Fibonacci ratio does not locate the good part of it. Any method that puts you long somewhere between half and two-thirds back into a 20-bar leg gets the same money. The number 0.618 contributes nothing detectable; if anything it points slightly past the useful zone.
Our Nasdaq battery reached the same verdict on seven years, where the 38% retracement beat the 62–79% zone. The S&P says it again on five years more data and with a five-band grid instead of a single comparison. Two markets, twelve and a half years on the longer one, and the ratio still does not locate anything.
What we changed in our own book
Nothing was built on any of this, which is the one piece of luck in the story. The fair value gap had been logged as an edge candidate and was one day from becoming a live sleeve when the bug surfaced — not through a placebo, which it had already passed, but through trying to write the agent. Nineteen realisable live state machines all lost money against a backtest claiming the setup paid. That gap between a backtest and every machine that could execute it is now a required check before any sleeve gets written.
The retracement result changes nothing either, because a generic trend pullback is not a product and the bands that pay are not the bands anyone is selling.
Methodology: ES continuous front-month, 15-minute bars resampled from our own trade prints, 290,664 bars from 2 January 2014 to 10 September 2026, all sessions. Order block = last opposite candle before a move taking out its extreme, limit at the block’s open, live from the confirming bar plus one, 48-bar validity. Fair value gap = three-bar imbalance, limit at the mid-gap, 48-bar validity. Liquidity sweep = trade through the prior day’s high or low with a close back inside, entry at that bar’s close against the sweep. OTE = 20-bar swing leg with a retracement into the named band, trend from EMA-50 read on the previous bar’s close, entry at the near edge of the band. Bracket on all four: stop 1× ATR(14), target 2× ATR(14), timeout 48 bars; a bar containing both is scored as the stop; one position at a time, released at the actual exit bar. Resting limits for order blocks and fair value gaps are resolved chronologically across all live levels, first touch takes the book, ties broken toward the level nearest the bar’s open; the superseded figures in this article come from the same script before that engine replaced the per-level forward scan. One contract, $4.50 commission plus two ticks of slippage per round trip, $29.50 on ES. Controls: order block at a random offset in the same session; liquidity sweep of a random mid-range level; fair value gap on non-gap bars, same EMA-50 side, entry distance sampled from the real gaps’ distribution. The fair value gap split is at 1 January 2021.
The trend pullback was the other result this bug produced, and the larger of the two.
Frequently asked questions
Do fair value gaps work on the S&P 500?
No. On 17,342 trades across twelve and a half years they lose $19.51 each, $338,428 in total at t = -5.41, and twelve of the thirteen calendar years are negative. Their matched-distance placebo loses $20.08, so the gap beats a price with no story attached by 57 cents a trade.
This article originally reported fair value gaps making $34.07 a trade. What happened?
That figure came from a bug in our fill engine. For each gap we scanned forward to find when its limit filled, which let a slow fill retroactively delete a sibling gap that would have filled earlier. Correcting it moved the result from +$34.07 to -$19.51 and raised the trade count from 14,005 to 17,342.
Do order blocks or liquidity sweeps do any better?
Neither. Order blocks lose $19.45 a trade and sweeps lose $30.33. Each does beat its own placebo, by $5.82 and $7.60 respectively, but beating a control by losing less than it does is not an edge.
Is the Optimal Trade Entry zone the best place to enter?
No. All five retracement bands are positive, and the 0.62–0.79 zone that the method names pays $8.46 a trade. The 0.50–0.62 band pays $32.49 and the 0.38–0.50 band pays $31.18, both at t above 8.
Does anything here survive?
The retracement pullback survives, but not the Fibonacci ratio attached to it. Entering on a pullback into a 20-bar swing leg pays in every band we tested; the specific 0.62–0.79 window pays the second least of the five.