The S&P Earns Its Return Overnight, and a Nightly Trade Costs Half of It
Across 3,642 sessions of our ES tick archive, 71.1% of the index's move happened while the cash market was shut. The overnight leg made $205,575 on one contract at t = 2.77 while the 09:30–16:00 session made $83,375 at t = 0.92, and the effect survives every robustness check we ran. Then one round trip a day cuts it to $98,136 at t = 1.32, with a deeper drawdown than the gross version. Simply holding, which requires no nightly trade at all, made $288,950.
Over twelve and a half years of ES, 71.1% of the S&P’s move happened while the cash market was closed. Holding only the Globex session returned $205,575 on one contract, at t = 2.77. Holding only 09:30 to 16:00 returned $83,375, at t = 0.92, which is not distinguishable from zero. The effect survives tail removal, both halves of the archive and every other control we pointed at it.
It still is not a strategy. Charging one round trip a day — the price of actually harvesting it — drops the overnight leg to $98,136 and t = 1.32, while the drawdown gets worse. Most of this series is kills. This one is a real anomaly that dies at the cash register, which is a different and more useful kind of result.
The rule
- ES minute bars from our own tick archive, New York time, 3 January 2014 to 10 September 2026.
- Overnight leg: buy the 16:00 cash close, sell the 09:30 open the next session. A real Globex hold.
- Cash leg: buy the 09:30 open, sell the 16:00 close. Same day, same contract.
- Baseline: hold everything, close to close. One position, no daily trade.
- One contract, no stop, no filter, every session in the window.
- $4.50 commission plus two ticks per round trip. An ES tick is $12.50, so $29.50 per round trip wherever costs are charged below.
The measurement convention matters more here than in most of these tests. The popular version of this claim compares a cash index’s settlement to its next open — a pair of prices nobody could have traded, on an instrument that does not exist between them. Ours is priced tick by tick through the Globex session, so the overnight leg is a position a real account could have carried, with a real exit at the real open.
Both legs, gross
Gross first, because that is the only way the two legs are comparable: the cash leg and the overnight leg each need exactly one round trip, so cost affects them identically.
| Overnight only | Cash session only | Hold everything | |
|---|---|---|---|
| Days | 3,642 | 3,642 | 3,642 |
| Total, one contract | $205,575 | $83,375 | $288,950 |
| Average per day | $56.45 | $22.89 | $79.34 |
| Median day | $50.00 | $0.00 | $50.00 |
| Sharpe | 0.73 | 0.24 | 0.65 |
| Days up | 53.7% | 47.3% | 52.9% |
| Best day | $8,675.00 | $25,325.00 | $23,612.50 |
| Worst day | −$10,425.00 | −$12,737.50 | −$16,375.00 |
| Max drawdown | $47,987.50 | $39,875.00 | $59,950.00 |
| t | 2.77 | 0.92 | 2.49 |
| p | 0.0057 | 0.3570 | 0.0128 |
The medians are the cleanest way to see it. The typical overnight hold makes $50.00. The typical cash session makes exactly nothing. That is not a tail effect showing up in the average; it is the middle of the distribution.
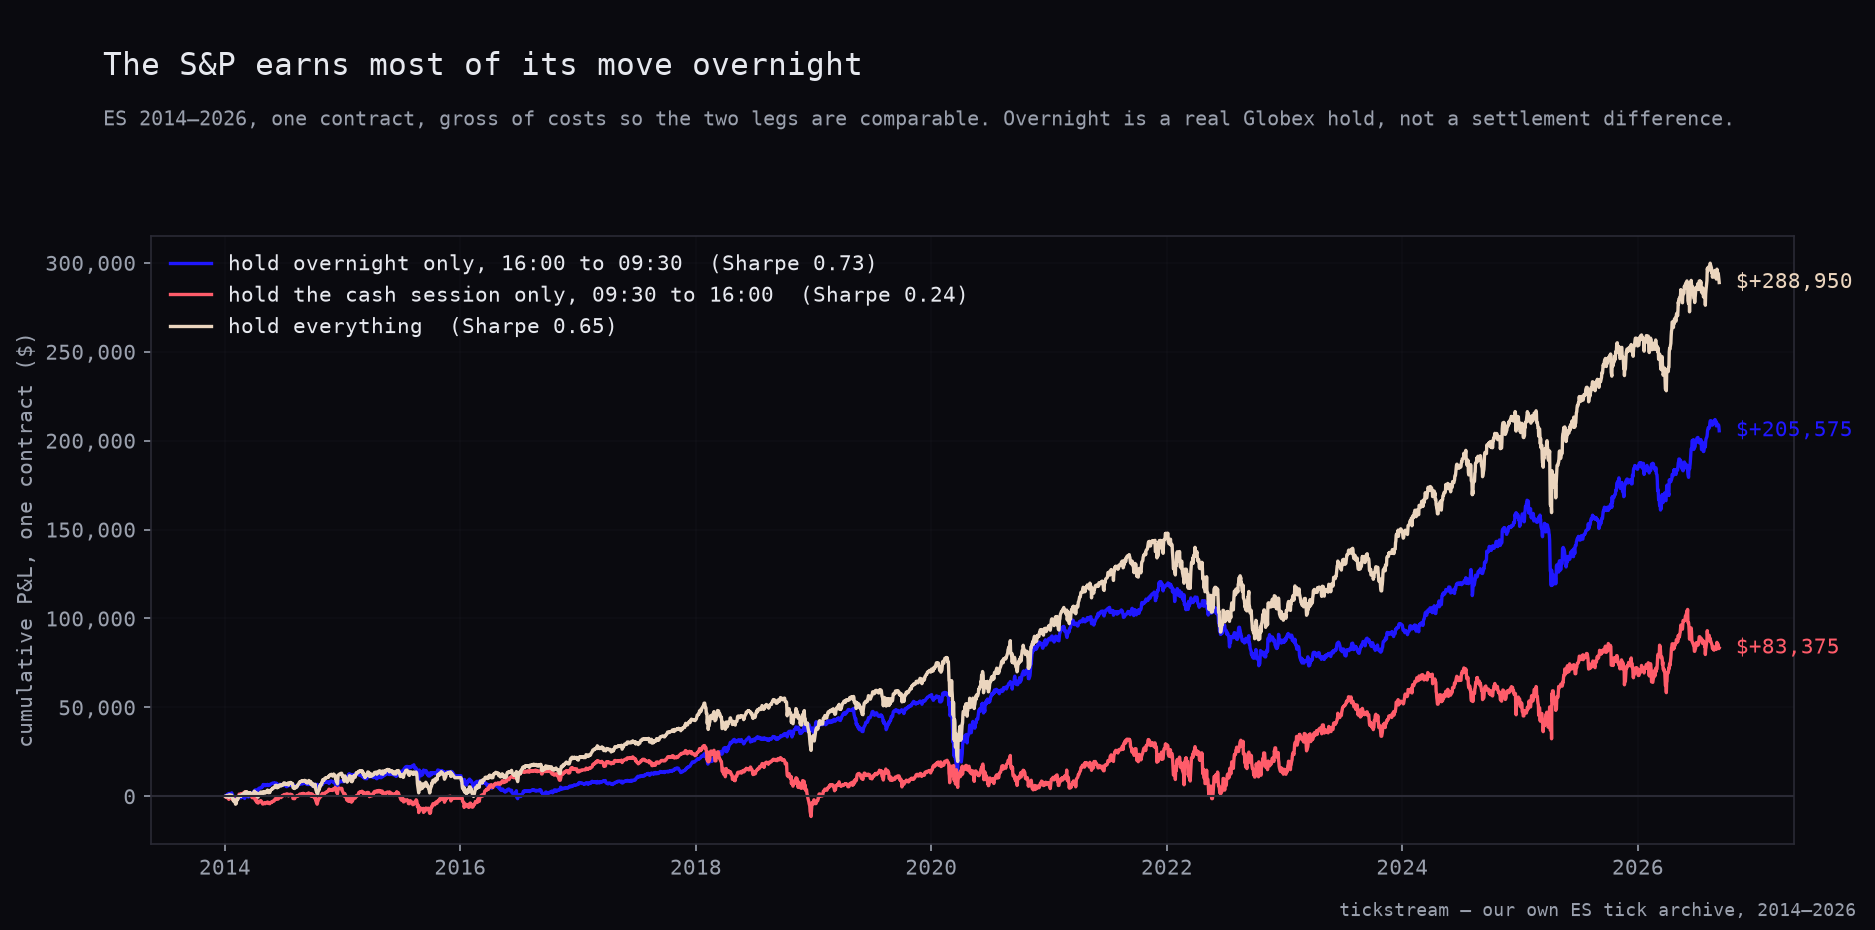
The chart below stacks three cumulative curves on one contract, gross: overnight only, cash session only, and the plain hold. Each carries its Sharpe in the legend and its final total at the right edge. The overnight line is the one that earns most of the move, which is what the chart is titled after. Watch the cash-session line through 2018 and 2022, and watch how little of the full curve’s shape it explains.
The controls it passes
Is it a handful of gap nights? We zeroed the largest absolute moves out of both legs, symmetrically, so neither side gets an advantage from the surgery.
| Largest moves zeroed | Overnight total | Overnight t | Cash total | Cash t |
|---|---|---|---|---|
| none | $205,575.00 | 2.77 | $83,375.00 | 0.92 |
| top 5 | $253,512.50 | 3.57 | $99,925.00 | 1.19 |
| top 20 | $201,312.50 | 3.09 | $118,237.50 | 1.48 |
| top 50 | $210,337.50 | 3.56 | $193,000.00 | 2.60 |
The overnight leg does not weaken. With the five biggest moves removed it is stronger than the full sample, at t = 3.57. So the effect is broad: it is in the body of the distribution, not in a few crisis nights.
The right-hand columns say something we did not go looking for. The cash session gets better every time its own tails come out, reaching t = 2.60 once the 50 largest moves are gone. The session’s biggest days are net losers. Whatever positive drift the cash window has is being eaten by its own violent sessions, which is a fair description of 2018 and 2022.
Does it hold in both halves? Our ES archive is twelve and a half years; the NQ archive that carries most of this series is seven. The first half of the ES window is the part we could not have tested before.
| Days | Total | Sharpe | t | p | |
|---|---|---|---|---|---|
| Overnight 2014–2019 | 1,650 | $56,387.50 | 0.92 | 2.36 | 0.0184 |
| Overnight 2020–2026 | 1,992 | $149,187.50 | 0.75 | 2.12 | 0.0341 |
| Cash session 2014–2019 | 1,650 | $13,800.00 | 0.18 | 0.45 | 0.6502 |
| Cash session 2020–2026 | 1,992 | $69,575.00 | 0.29 | 0.82 | 0.4145 |
Both overnight halves are significant on their own. Neither cash half is. That is about as robust as anything in this series gets. The older half — the five years that only exist because the ES archive starts in 2014 — is the stronger of the two on Sharpe, at 0.92.
The part that decides it
Everything above is gross. To harvest the overnight effect you have to enter at every cash close and exit at every open, which is one round trip a day, 3,642 of them. Here is the same measurement with $29.50 charged each time.
| Gross | Net of one round trip | |
|---|---|---|
| Overnight total | $205,575.00 | $98,136.00 |
| Overnight average per day | $56.45 | $26.95 |
| Overnight Sharpe | 0.73 | 0.35 |
| Overnight max drawdown | $47,987.50 | $58,580.50 |
| Overnight t | 2.77 | 1.32 |
| Overnight p | 0.0057 | 0.1868 |
| Cash session total | $83,375.00 | −$24,064.00 |
| Cash session Sharpe | 0.24 | −0.07 |
| Cash session t | 0.92 | −0.27 |
The overnight leg stops being significant. Note the drawdown line especially: costs do not just shave the top off the curve, they deepen the hole, from $47,987.50 to $58,580.50. You pay the charge on losing runs too, which is exactly when it hurts.
Now put that against the baseline. Holding everything — one entry, no nightly trade, no daily charge — made $288,950 at Sharpe 0.65 over the 3,642 days in this window. That is the same total the momentum study quotes at Sharpe 0.70, where it is spread over the 3,223 sessions that test trades. Different denominator, same money. The nightly version, at its best, is a worse-performing subset of the thing you get for free by doing nothing.
The conclusion is a single line, and it is the only sentence in this article worth remembering. The overnight effect is real, and the way to capture it is to stop trading, not to trade every night. Anyone selling you a nightly-entry system built on this anomaly is selling you the cost side of it.
The cash-session net number is the smaller half of the same lesson. Day trading the S&P index itself, with no edge and one round trip, is −$24,064 over 3,642 days at Sharpe −0.07. Not a catastrophe. Just the charge, collected 3,642 times.
Where in the night
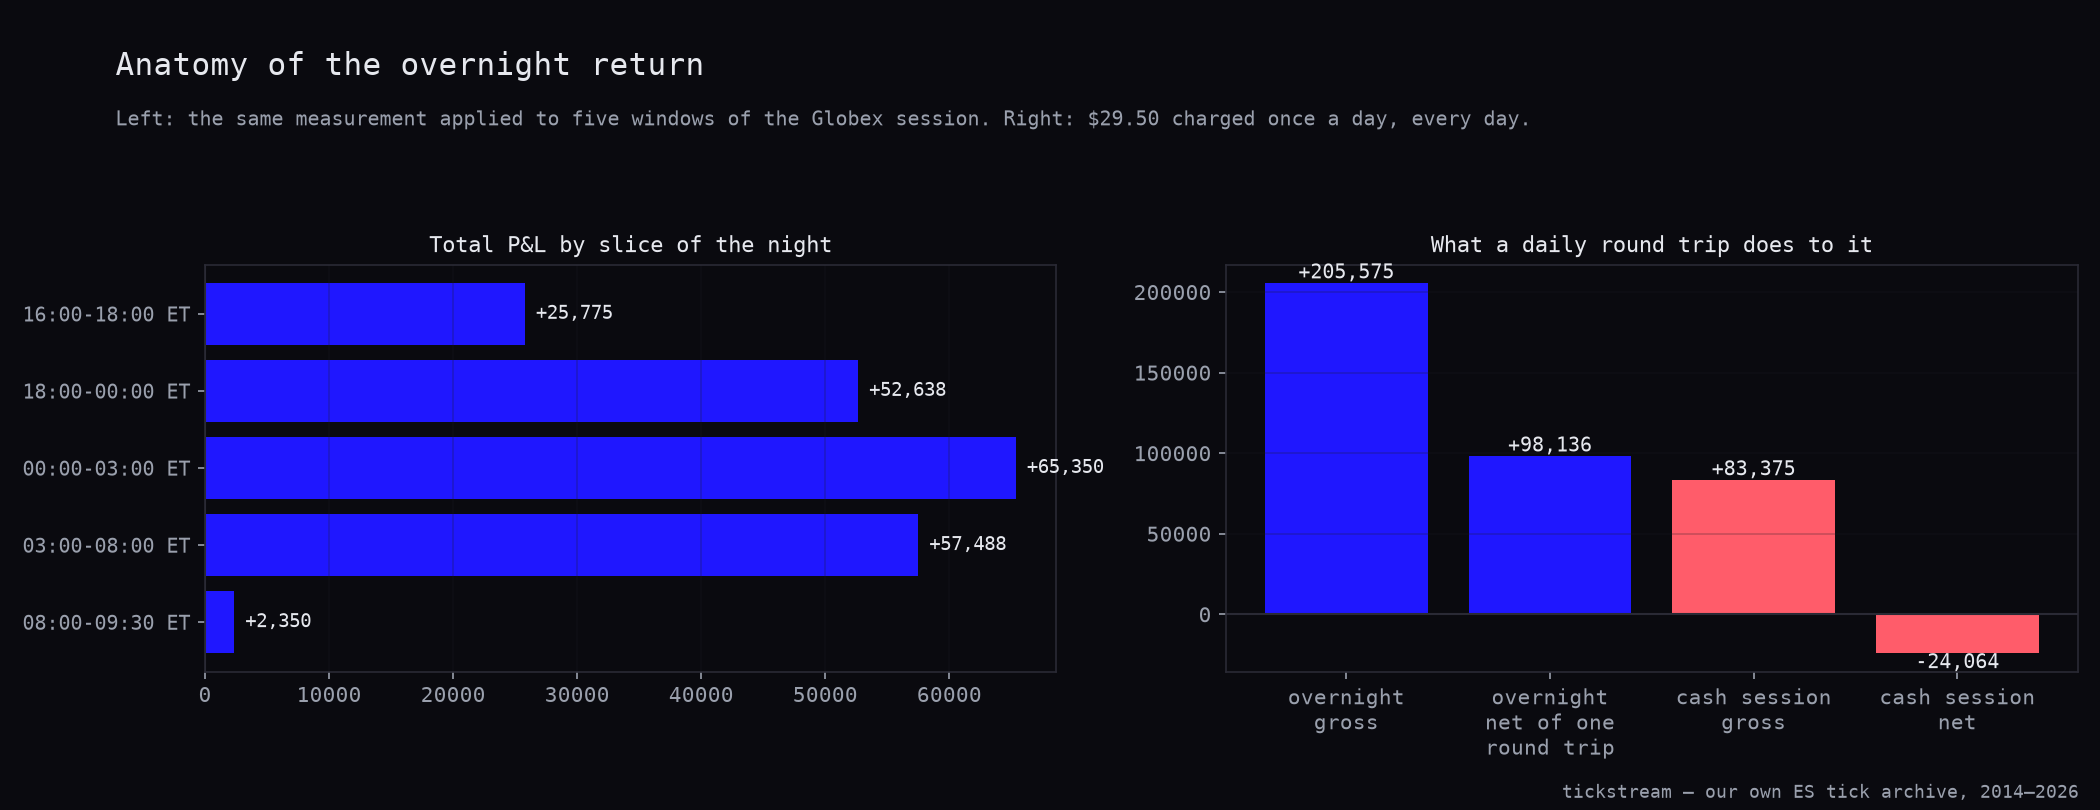
We split the Globex session five ways and applied the identical measurement to each window. The left panel below is that split; the right panel is the gross-versus-net comparison for both legs, which is the picture of the previous section.
| Window (ET) | Days | Total | Sharpe | Days up | t | p |
|---|---|---|---|---|---|---|
| 16:00–18:00 | 3,203 | $25,775.00 | 0.39 | 50.6% | 1.39 | 0.1654 |
| 18:00–00:00 | 3,275 | $52,637.50 | 0.39 | 50.4% | 1.39 | 0.1638 |
| 00:00–03:00 | 3,266 | $65,350.00 | 0.77 | 50.6% | 2.76 | 0.0058 |
| 03:00–08:00 | 3,239 | $57,487.50 | 0.42 | 54.3% | 1.49 | 0.1358 |
| 08:00–09:30 | 3,262 | $2,350.00 | 0.02 | 49.0% | 0.08 | 0.9391 |
Day counts differ per window because the Globex session does not open every window on every calendar day. The eye-catching row is the last one: the run-up into the cash open, the window retail traders watch hardest, contributed $2,350 at Sharpe 0.02 across more than three thousand days.
The eye-catching row in the other direction is 00:00–03:00 ET, the European morning, and we are not going to crown it. We ran five windows, which is five tests. One of five clearing p = 0.05 is roughly what chance produces, and we have no forward sample to check it against. Treat the slice table as a description of where the return sat historically, not as an instruction about when to be positioned.
Where in the week
The same caution, harder. Wednesday nights are the best in the archive by a wide margin.
| Night | Days | Total | Average | Sharpe | Days up | t | p |
|---|---|---|---|---|---|---|---|
| Mon | 643 | $67,162.50 | $104.45 | 1.04 | 54.4% | 1.67 | 0.0963 |
| Tue | 657 | $43,512.50 | $66.23 | 0.86 | 53.3% | 1.39 | 0.1636 |
| Wed | 651 | $80,537.50 | $123.71 | 1.67 | 59.1% | 2.69 | 0.0073 |
| Thu | 649 | −$6,112.50 | −$9.42 | −0.11 | 53.0% | −0.18 | 0.8546 |
| Fri | 628 | $24,625.00 | $39.21 | 0.53 | 55.6% | 0.84 | 0.4027 |
Wednesday nights total $80,537.50, more than a third of the whole overnight result on a fifth of the nights. Thursday is the only negative weekday, at −$6,112.50. We do not believe it, and we will say why plainly. Five weekdays is five tests, exactly like the five slices. There is no mechanism here — no settlement, no auction, no scheduled flow that lands on Wednesday nights and not Tuesday nights. The effect we are actually measuring, the broad one, showed up in every robustness cut we ran. A weekday concentration that appears in none of those cuts is the profile of a subgroup found by looking. “Trade Wednesday nights” is not a recommendation this table supports.
Year by year
| Year | Overnight | Cash session |
|---|---|---|
| 2014 | $8,387.50 | $2,912.50 |
| 2015 | $3,162.50 | −$4,025.00 |
| 2016 | −$4,737.50 | $14,825.00 |
| 2017 | $12,925.00 | $9,112.50 |
| 2018 | $18,537.50 | −$26,937.50 |
| 2019 | $18,112.50 | $17,912.50 |
| 2020 | $32,100.00 | −$6,250.00 |
| 2021 | $30,137.50 | $20,500.00 |
| 2022 | −$32,012.50 | −$12,912.50 |
| 2023 | $9,675.00 | $37,900.00 |
| 2024 | $56,262.50 | −$162.50 |
| 2025 | $31,412.50 | $16,437.50 |
| 2026 | $21,612.50 | $14,062.50 |
Two years show the split at its starkest. In 2018 the overnight leg made $18,537.50 while the cash session lost $26,937.50. In 2024 the overnight leg made $56,262.50 — its best year — while the cash session finished at −$162.50, which is as close to a flat year as the tape produces.
2022 is the year that keeps the story honest. Both legs lost, the overnight leg by $32,012.50. The effect is a tilt, not a shield: when the index falls hard for a year, being long only at night still loses money.
What we changed
Nothing in the live book, and that is the finding rather than an absence of one.
- We are not adding a nightly-entry sleeve. The gross case is strong and the net case is not, at t = 1.32. A sleeve that needs its costs to disappear before it works is not a sleeve.
- The baseline stays the baseline. Holding everything paid $288,950 with one trade. Any overnight product has to beat that after costs, not beat zero, and this one does not.
- Slice and weekday tables get an explicit multiple-testing line from now on. We printed five night windows and five weekdays in this article, and both tables have a winner that would look tradeable if we quoted it alone. We would rather label our own subgroup results than let a reader mistake them for signals.
We have not published an NQ version of this test, so there is no second verdict to compare yet. The nearest neighbours in this series are the two gap studies, which measure the same overnight window from the other end: gaps on ES against a mirror control and the original NQ gap-fill test.
The archive this ran on is for sale: ES ticks back to 2014 with the real aggressor side on every print, in the historical data packages.
Methodology: ES minute bars in New York time, built from our own tick archive, 3 January 2014 to 10 September 2026, 3,642 sessions. Overnight is the 16:00 cash close to the next 09:30 open, held through Globex; cash session is 09:30 to 16:00; the baseline is close to close. One contract throughout. Gross figures carry no cost so the two legs stay comparable; net figures charge $4.50 commission plus two ticks slippage per round trip, $29.50 in total, once per day. Sharpe is annualised at 252 days. t-statistics are one-sample against zero on the daily P&L series. Tail controls zero the k largest absolute moves in each leg independently; the split is at 1 January 2020. Night-slice day counts differ because the Globex session does not cover every window on every calendar day.
Frequently asked questions
Is it true that the S&P only goes up overnight?
On our ES archive it is close to true. Over 3,642 sessions from January 2014 to September 2026, the overnight leg accounted for 71.1% of the index's total move, returning $205,575 on one contract against $83,375 for the cash session. The overnight leg reaches t = 2.77, the cash session t = 0.92, so only one of the two separates from zero.
Could the overnight result just be a few huge gap nights?
No, and we tested it three ways. Zeroing the 5, 20 and 50 largest absolute moves from both legs leaves the overnight leg at t = 3.57, 3.09 and 3.56, against t = 2.77 on the untouched sample. The totals move in both directions around the base — $253,512.50, $201,312.50 and $210,337.50 against $205,575 — so what strengthens is the significance, not the size. The return sits in the body of the distribution rather than in a few crisis nights.
Can you actually trade the overnight effect?
Not by entering every night. Charging $29.50 for one round trip a day takes the overnight leg from $205,575 to $98,136, Sharpe from 0.73 to 0.35, and the t-statistic to 1.32 with p = 0.1868. The drawdown also grows from $47,987.50 to $58,580.50, so the trading version is both smaller and rougher.
Which part of the night carries the move?
Only 00:00–03:00 ET clears significance, at $65,350 with Sharpe 0.77 and p = 0.0058. The 08:00–09:30 ET run-up into the cash open — the window most people assume matters — contributed $2,350 at Sharpe 0.02. We split the night five ways, so one window clearing p = 0.05 is roughly what chance produces on its own.
Does day trading the S&P index itself lose money?
Mildly, on this measurement. The cash session net of one round trip is −$24,064 over 3,642 days, Sharpe −0.07, t = −0.27. That is not a claim that intraday trading cannot work; it is what holding the index from 09:30 to 16:00 with no edge and one daily charge costs you.